We select and install.
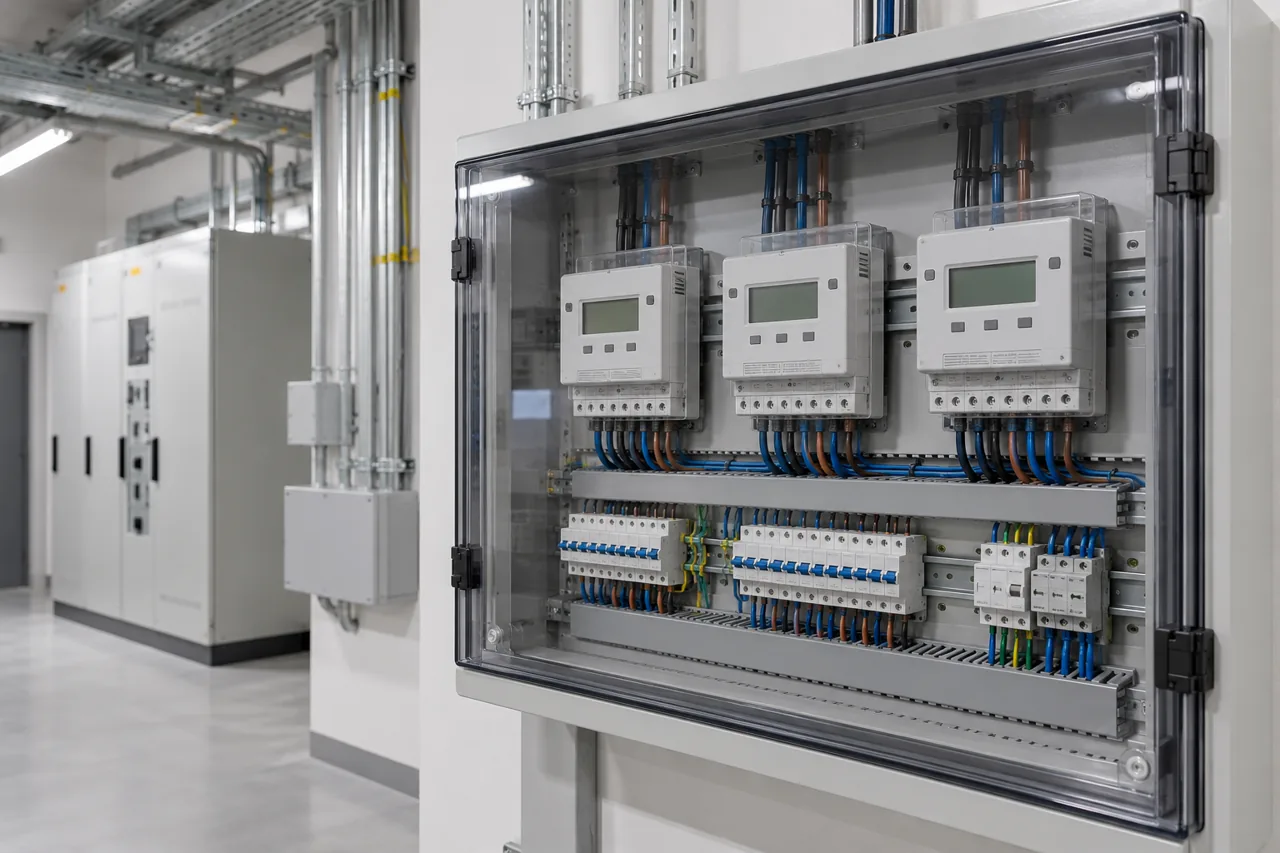
We review the installation, unit layout and billing process. We select meters, connectivity and measurement points. One company handles installation and commissioning.

Explore submetering, try a sample statement and calculate time spent on readings.
FROM METER TO STATEMENT
Walking the building, photographing displays, copying readings and explaining differences? Manual readings delay invoice preparation and leave room for errors. There is a simpler way.
We review the installation, unit layout and billing process. We select meters, connectivity and measurement points. One company handles installation and commissioning.
Remote readings from compatible equipment replace collecting photographs. Reading frequency and connectivity follow the conditions at your property.
The system calculates consumption and the amount using the recorded rate. Statements can be generated periodically and sent to the manager and the relevant tenant.
TRY IT WITHOUT SIGNING IN
Change the unit, consumption and rate. Explore the amount, comparison and sample statement. This is a demonstration; no message will be sent.
Café / unit 01
MORE THAN A READING
Useful for the manager. Clear for the tenant.
Period statements, reading history, rate-based amounts and data export. Ready to support billing, without starting from a blank spreadsheet every month.
Managers see their properties. Tenants receive a report for their own unit. Other tenants’ data need not circulate in a shared spreadsheet.
Compare months and previous years. Once sufficient history is available, AI-assisted consumption forecasting and unusual-change analysis can be implemented. Forecasts support planning; they do not replace billing readings.
Start with a selected property. Add units and measurement points while retaining the manager’s familiar workflow.
HOW LONG DO YOUR READINGS TAKE?
An estimate of the time spent collecting and entering readings, excluding travel and investigating errors.
FEWER ROUTINE TASKS. MORE CONTROL.
The main change is an organised flow of information: from the meter, through the statement, to the person preparing the bill.
Work with data in one place instead of waiting for photographs and handwritten readings. Remote readings require suitable meters and commissioned connectivity.
Consumption comes from the difference between readings, and the amount from the agreed rate. Reduce copying figures between notes, spreadsheets and messages.
Tenants see the period, opening and closing readings, consumption and applied rate. Discussions refer to specific data.
History lets you revisit previous periods, compare results and prepare a budget. A change of property staff need not mean losing an organised record.
DATA FOR THE NEXT STEP
A reliable measurement history supports better decisions.
Higher costs can result from consumption, rates or the length of the period. Organised data helps distinguish these causes and ask the right questions.
Review consumption across months. Year-on-year comparisons require enough history and consideration of tenancy and usage changes.
Once history has been collected and checked, models can be commissioned to estimate future use. This is an additional implementation scope. Forecasts are clearly labelled and do not replace billing readings.
With frequent readings, the system can be extended to identify increases and after-hours consumption. Availability and accuracy depend on equipment, transmission and agreed rules.
HAND OVER THE READINGS. RECLAIM YOUR TIME.
Send the number of submeters, location and current billing process.
We will agree a practical scope, from installation to ongoing support.